Features · August 9, 2026
Reading Analytics in Shelfies: Heatmaps, Genres and Year in Review
Genre breakdowns, pace trends, activity heatmaps and a full Year in Review — the reading statistics Shelfies builds from your sessions.
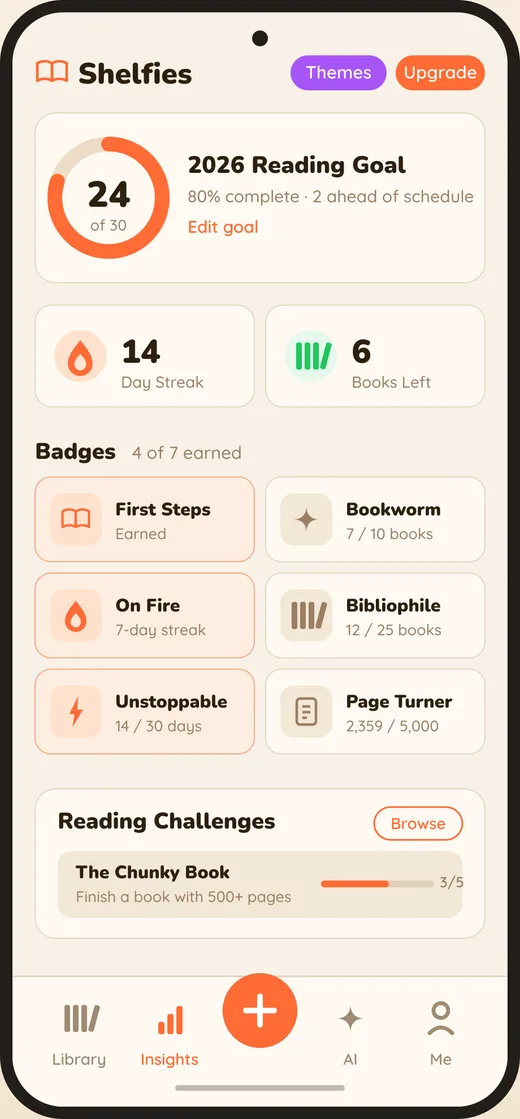
Top genres, and the surprise in them
Almost nobody guesses their own genre split correctly. People who think of themselves as literary fiction readers turn out to read mostly thrillers; people who claim not to read non-fiction have twelve of them. The chart is worth it for that alone.
Pace trends
How fast you read, and how that moves across the year. Two things usually show up: a summer dip nobody remembers having, and the fact that long books are not actually slower per page — they just have more pages, which is a different problem.
Activity heatmap
A year of reading days at a glance. It answers the question that matters most for a habit: not how much you read, but how regularly.
Year in Review
The wrapped-style summary at the end of the year — totals, standouts, the shape of your reading. It is the payoff for twelve months of logging, and the thing most people actually share.
Why logged beats estimated
Every number here is only as good as the sessions behind it. Trackers that ask you to estimate produce statistics that confirm whatever you already believed. Timed sessions produce statistics that occasionally tell you something you did not want to hear, which is the only kind worth having.
Shelfies is a modern, mobile-first reading tracker with AI recommendations, progress tracking, streaks, and quotes — built to replace Goodreads and StoryGraph for readers who want a faster, prettier experience.
Try Shelfies free
The modern, AI-powered reading tracker. 24-hour free trial of every Pro feature — no credit card to start.
Open Shelfies